Exploring Probability Concepts
This chapter in Surviving Statatistics explores computing proabilities, which is essential when working with statistics.
Note: This chapter is excerpted from Luther Maddy’s Surviving Statistics textbook (C) 2024 which is available in printed or eBook format from Amazon.com
Instructional Videos
Surviving Statistics: Probability Concepts
Surviving Statistics: BlackJack and Probability Computations
Business Statistics: Probability Concepts
Exploring Probability Concepts
Probability is the likelihood of something happening - being struck by lightning for example. Probability ranges from 0 to 1 and is usually represented as a percentage from 0% to 100%. We often commonly express probability as the odds or chances of some occurrence.
Some examples of probably include:
The odds of flipping a coin and having it land as tails.
The likelihood that your favorite college football team wins the national championship.
The chances of you drawing a king from a full deck of 52 cards.
The chances of rolling a single die and it coming up six.
Then odds of you winning the lottery.
Probability is a very important aspect of inferential statistics. Remember inferential statistics infers or makes educated guesses about populations based on samples.
Inferential statistics is a tool businesses use to attempt to predict what percentage of people will buy a new product.
Inferential statistics is a tool epidemiologists use to estimate what percentage of people will become infected with a new virus.
Inferential statistics is a tool psychologists use to determine the percentage of people who will suffer from depression if they become unemployed.
Probability is based on experiments and outcomes. The experiment is the process that creates the outcome, tossing a coin for example. The outcome is the result, landing as tails.
Methods of Assigning Probability
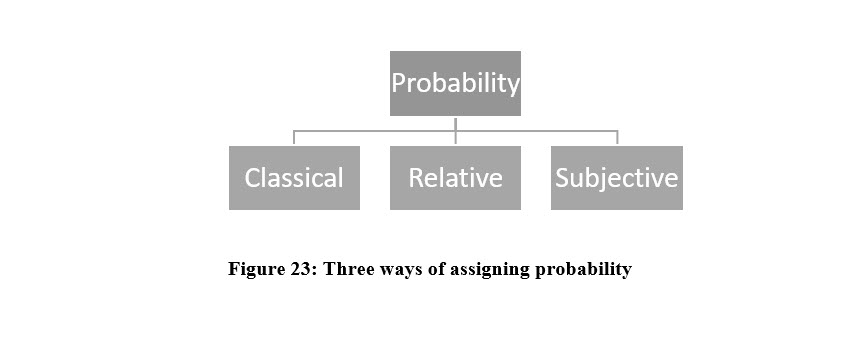
There are three methods: classical, relative frequency (empirical), and subjective.
CLASSICAL PROBABILITY
Classical probability is used when there are a set and finite number of outcomes and all outcomes are equally likely. For example, when you toss a coin, you will get either heads or tails. With classical probability, there is no guessing. You know the probability of the outcome before the experiment begins.
RELATIVE FREQUENCY OR EMPIRICAL PROBABILITY
Empirical probability determines probability based on repeated experiments or existing knowledge. For example, assume that 60 of last 100 customers in a coffee shop ordered a large coffee. What is the likelihood (probability) that the next customer will order a large coffee? Based on relative frequency, the probability is 60%.
SUBJECTIVE PROBABILITY
Subjective probability is based on intuition, guesses, and hunches, and has limited value in statistical research and analysis. Subjective probability begins with gathering all possible information and then, based on that information making a subjective guess about the odds of something occurring. For example, before the professional football season begins you gather information about your favorite team and the other teams and then subjectively choose what you believe to be that team’s chances of winning the big game at the end of the season.
Check your understanding:
Choose the method used to assign probability in each of the following examples:
1. The odds of picking the queen of hearts from the top of a deck cards.
2. The chances of being struck by lightning in the United States this year.
3. At your first horse race, you like the looks of horse #4 and think the odds of it winning are good.
Answers:
1. We can compute the exact probability. There are 52 cards in a deck and one queen of hearts, so the probability is 1/52. This is an example of the classical method.
2. Every year approximately 270 people in the US are struck by lightning. With a population of approximately 330 million, your chances would be 270/330 million. This is an example of using relative frequency to determine probability.
3. You are an amateur and make a guess based on the appearance of the horse. This is an example of subjective probability.
Computing Probabilities
IMPORTANT TERMS
Before we begin discussing probability, here are some terms you should become familiar with.
Experiment
The process that generates the occurrence of one of several possible results.
Outcome
The result of an experiment. For example, the number you get from rolling a single die once.
Event
A collection of experiment outcomes. The values recorded from the experiment, rolling a die six times.
Collectively Exhaustive
When an experiment is conducted, at least one of the possible outcomes must occur. For example, when you roll a die, one number: 1, 2, 3, 4, 5, or 6 must come up.
Mutually Exclusive
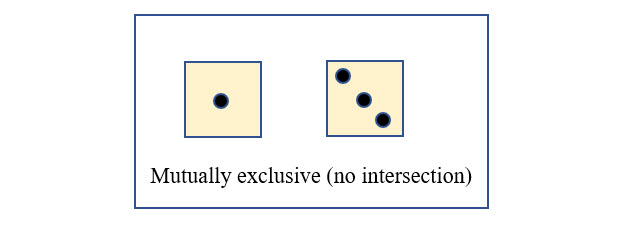
One outcome result precludes any other possible outcome at the same time. For example, you cannot roll a 2 and a 4 on a die at the same time.
Independent Events
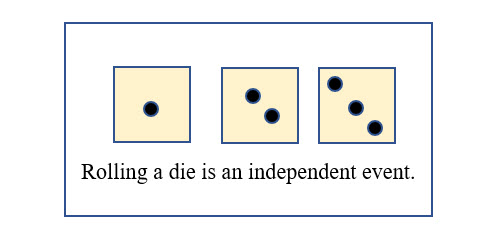
The occurrence of one outcome has no effect on the probability of another event occurring. For example, rolling a 1 on a die does not influence the value on the next or future rolls. After rolling a 1, you are just as likely to roll another 1 as you are to roll a 6.
Now that we have some of the terminology out of the way, let’s dig into computing probabilities.
COMPLIMENT RULE
When assigning probabilities, the sum of all possible outcomes must equal, 1 or 100%. Knowing this, the compliment rule lets you assign probability for an outcome by knowing the probability of that outcome not occurring.
The compliment rule tells us the probability of an outcome is equal to 1 – the probability of not that outcome: P(A) = 1 – P(~A). Note: we are using the ~ symbol to represent “not”.
For example, the probability of not drawing the queen of hearts off the top of a deck of cards is 51/52. So, the probably of drawing the queen of hearts is:
P(Queen of Hearts) = 1 – P(~Queen of hearts) or 1- 51/52 = 1/52
RULES OF ADDITION
Addition for Mutually Exclusive Events
When two events are mutually exclusive, to compute the probability of either one event or another, simply add the two probabilities. That is expressed as:
TP(A or B) = P(A) + P(B)
What is the probability of rolling a single die and getting either a 1 or a 3?
P(1) = 1/6 P(3) = 1/6
P(1 or 3) = 1/6 + 1/6 = 1/3
TThis is a mutually exclusive event, because you cannot roll a 1 and a 3 at the same time. These two possibilities do not intersect.
Addition for Non-Mutually Exclusive Events
One or more non-mutually exclusive events can occur at the same time. The occurrence of one does not preclude the other from occurring, it is possible these events may overlap.
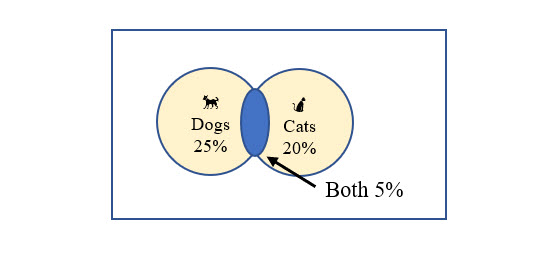
For example, assume you conducted a survey of all the residents in your city (population) to see if they owned cats, dogs, or neither. Your survey found that 25% of those in the survey own dogs and 20% own cats. However, 5% of those you surveyed own both a dog and a cat. This is shown in the illustration below.
What is the probability that a resident of your city has either a cat or a dog?
P(A or B) = P(A) + P(B) – P(A and B)
P(Cat or Dog) = P(Cat) + P(Dog) – P(Cat and Dog) = .25 + .20 - .05 = .40
So, the likelihood of any resident in your city owning a cat or a dog is 40%.
RULES OF MULTIPLICATION
Multiplication for Independent Events
When events are independent, one outcome has no effect on other outcomes, the probability of two events occurring are the probability of the first event multiplied by the probability of the second.
P (A and B) = P(A) * P(B)
For example, what is the probability of tossing a coin and having it come up heads both times?
P(A-heads and B-heads) = .5 * .5 = .25
If the events are independent, the same concept applies no matter how many events are included.
For example, what is the probability of rolling one die three times and having it come up 1, 2, and 3 in that order.
P(1, 2, 3) = P(1) * P(2) * P(3) = 1/6 * 1/6 * 1/6 = 0.00463
Multiplication for Dependent Events
Events are dependent when one outcome does affect other outcomes. This is represented with the given that symbol |. So, for dependent events:
P(A and B) = (P(A) ) (P(B | A))
The probability of both events occurring is the probability of the first one, A, multiplied by the probability of B occurring, given that A has already occurred.
As an example, consider a bowl that contains 20 pieces of candy. Ten are blue and ten are yellow.
What is the probability of choosing two candies at random and having them both be blue?
P(Blue1 and Blue2) = P(Blue1) * P(Blue2 | Blue1) = 10/20 * 9/19 = 0.23684
Randomly choosing a blue candy the second time, given that the first candy was also blue is 9/19 because there are only 9 blue candies left and 19 total left.
The second blue outcome is an example of conditional probability. Conditional probability is the probability of a specific event occurring given that another event, Blue1 in this case, has already occurred.
Contingency Tables
When we attempt to classify observations with two or more categories, we often create contingency tables. Contingency tables lay out the responses in a crosstab format. Computing probabilities in contingency tables use the dependent events formula.
As an example, assume you want to see if male students have different fast-food preferences than female students. In your survey, you ask the students to select their favorite fast-food restaurant from a group of three. The results are then classified by male/female and then counts are displayed for each favorite restaurant. The results are displayed in the contingency table below.
The contingency table clearly displays dependent events. For example, the value of 23 in the Chicken Deluxe column is dependent on the gender being male. Here are some examples of using the table to compute probabilities.
What is the probability of finding respondent who is female and prefers Burger Queen?
We again use this formula: P(A and B) = (PA) (P(B | A)
So, P(Female and Burger Queen) = (P(Female)) ( P(Burger Queen | Female))
(63/108) (18/63) = 0.1667
Counting Principles
When we are conducting an experiment, it is often important to know how many possible outcomes can result. For example, if you toss a coin, there are two possible outcomes. Assume though that the experiment is tossing three coins, or four. (Not tossing one coin four times.) Then the number of possible outcomes becomes much larger. In determining the number of outcomes, three methods commonly used.
MULTIPLICATION FORMULA
When an experiment has multiple steps, or a certain way of doing one thing and another way or ways of doing another, you use the multiplication formula to determine the total number of outcomes. For example, think of an experiment of rolling two dice. The first die has 6 possible outcomes and so does the second.
Using the multiplication formula, the total number of outcomes is:
(Outcome1) (Outcome2) = (6)(6) = 36
As another example, assume your statistics teacher gives you a test with three questions and each has four choices. How many ways can you complete the test?
(3 questions) (4 answers) = 12
COMBINATION FORMULA
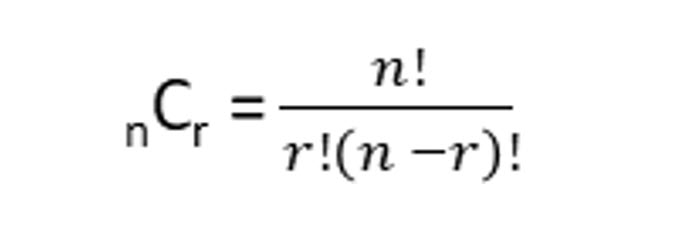
The combination formula allows you to compute how many ways r items can be selected from a larger group, n. Assume you own seven movies and have decided to watch two in a row on a boring weekend. How many different combinations of those two movies are possible?
To answer this question, you would use the combination formula:
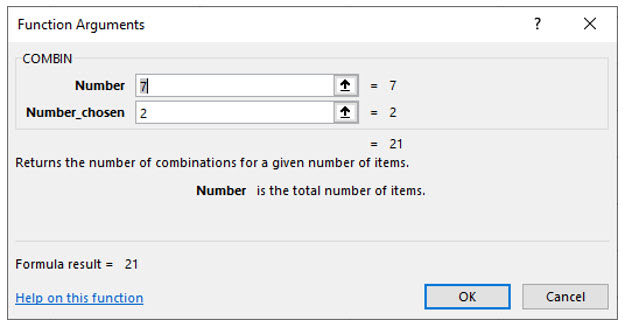
In this formula, ! means factorial. So, solving your movie binging dilemma looks like:
So, selecting two movies from the seven you own results in 21 possible movie combinations.
PERMUTATION FORMULA
When you wanted to know how many combinations were possible in watching two out of the seven movies you own, using the combination formula yielded twenty-one possible combinations. With the combination formula, the order in which you watched to two movies was not important.
However, if instead of only asking what combination of two movies you could watch, you also wanted the combinations to include a specific order of the movies watched. In other words, you want to create a list that tells you to watch one specific movie first and then watch another specific movie second. In that case, you would use the permutation formula.
The permutation formula computes how many combinations of r are possible from n when the order is important.
Using the same example, how many combinations of two movies from the seven you own are possible when you also want the order watching one first and then another?
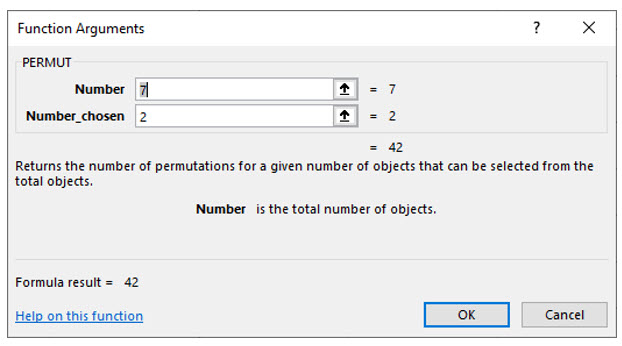
The permutation formula:
So, when the order is specified as this movie first and that on second, there are 42 possible combinations.
Check your understanding:
Ponder the following questions:
1. Why, when you are working with the same two movies out of the seven you own, are there more permutations than combinations?
2. You locked your bicycle with a 4-digit combination lock with digits 0 – 9 but forgot how to open it. How many different four-digit patterns are possible?
3. You have two pairs of shoes, three pairs of pants, and five shirts. How many different outfits can you create from your wardrobe?
Answers:
1. When the order is important, you use permutations. This means that a pair of two movies can be chosen more than once with permutations. For example, you could watch movie A first and then movie B. Or, you could watch B first and then A. So, the paring A – B, and B – A are possible using permutations.
With the combination formula, the order is not important. So, selecting A and then B, or B and then A represent only one combination when the order is not a consideration.
2. Since the order is important and numbers do not repeat, you will compute this with the permutation formula. With n = 10 and r = 4, the number of permutations possible is 5040.
3. This is an example of when to use the multiplication formula for independent events. The number of outfits is: 2 * 3 * 5 = 30
Try it in Excel:
Excel has functions for computing with Combinations or Permutations.
Sponsored Ads
1004
