Advanced Report Features
Much of the power in an Access database comes when you intitally set it up. One of the essential elements of proper database design is understanding how to use Access' Reports. This lesson will step you through using Access' advanced report features.
Note: These lessons are excerpted from Luther Maddy’s Access Workbooks (C) 2024 which are available in printed or eBook format from Amazon: Access: The Basics and Access: Beyond The Basics
>
Advanced Report Features
Calculations in reports
The procedure for creating calculated fields in reports is similar to the process of creating computed fields in forms. To create a new field in a report, create a new text box using the Controls group and enter the formula in the text box.
Reports often have different sections and certain computations can only be placed in certain sections. A grand total for the entire report must be placed in the Report Footer. A sub-totaling computation must be placed in the Group Footer. In this lesson, you will create two calculated fields: a text-based computation and a count of each client’s trips.
1. If needed, open the No Fault Travel database.
2. Use the Report Wizard to create a report based on the following fields: FirstName and LastName in TblClients; and DestinationID, DepartureDate, ReturnDate, and Cost in TblTrips.
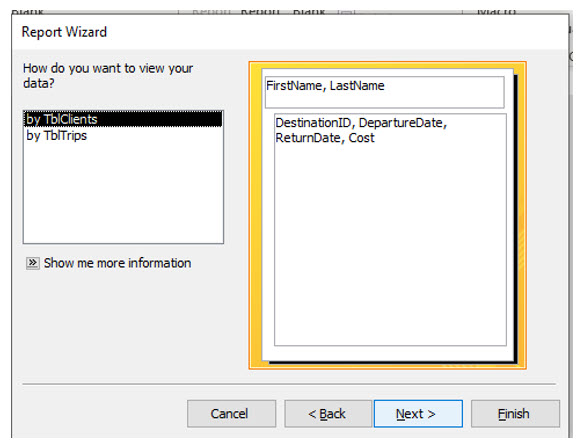
3. When asked how to view the data, choose by TblClients and then click Next.
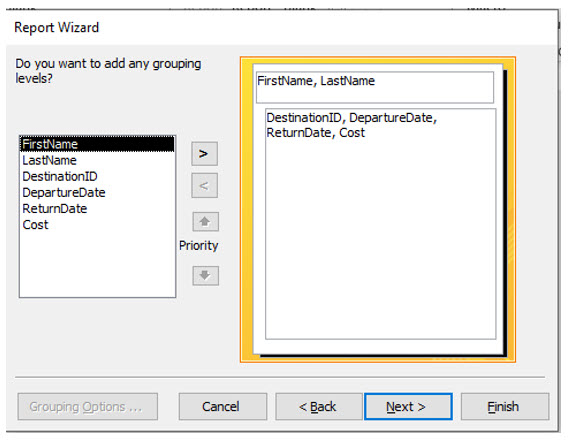
4. Do not add any additional grouping levels and click Next.
This report will already group by clients since you told Access that is how you wanted to view the data in the previous step.
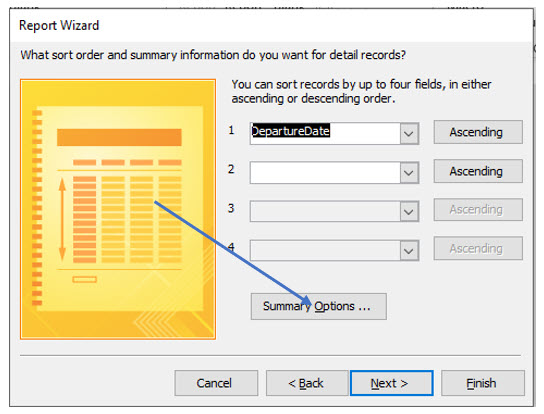
5. Choose to sort by DepartureDate. Then, click the Summary Options… button.
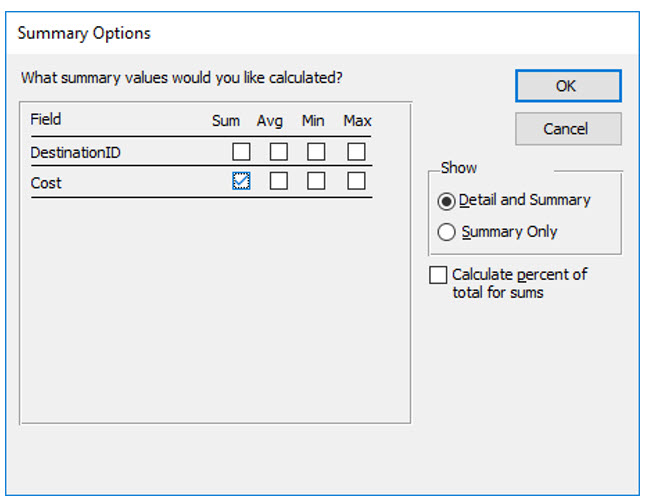
6. In the Summary Options dialog box, select Sum for Cost. Click OK, and then click Next.
Leave the Detail and Summary option selected.
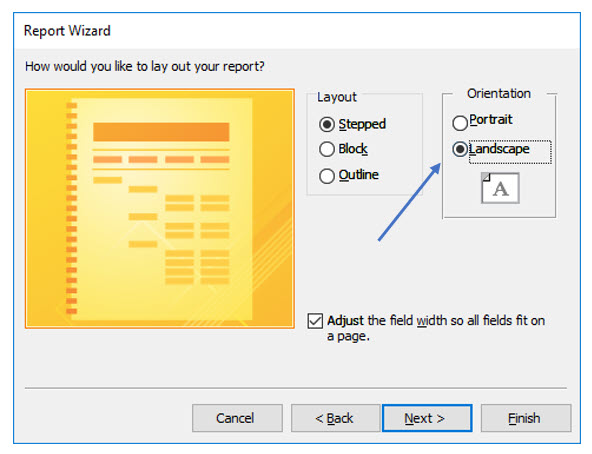
7. Choose Stepped Layout and Landscape Orientation. Click Next.
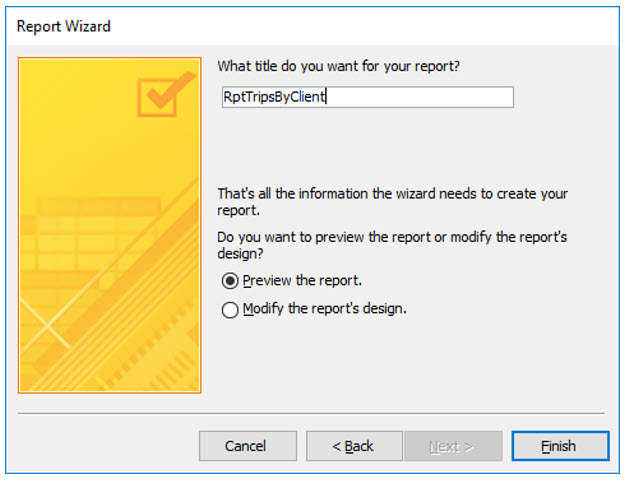
8. Title the report RptTripsByClient and click Finish.
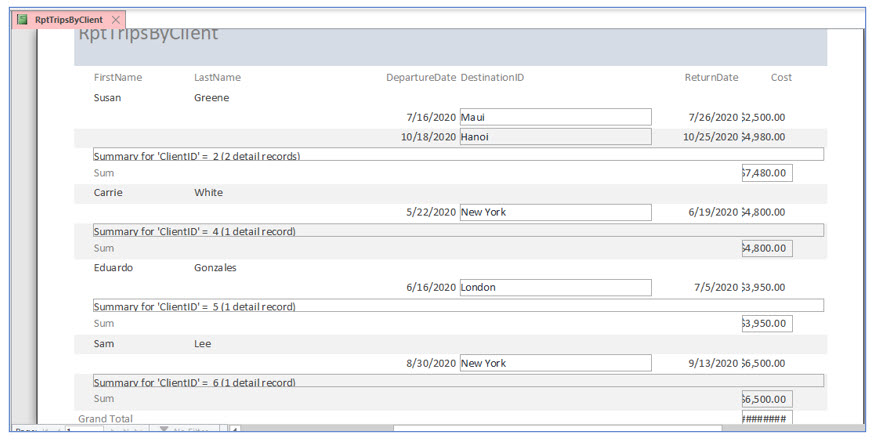
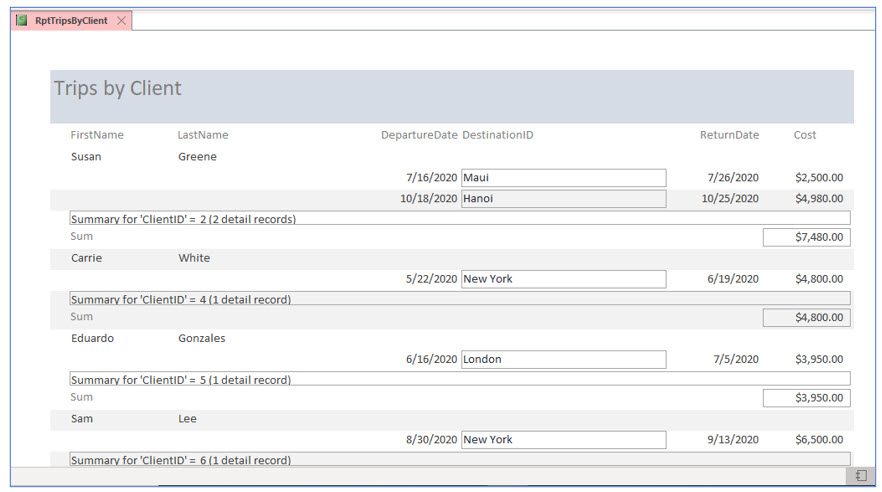
A report preview should now be visible.
Some text boxes are not large enough to display the values from the tables. The hashtags (#) in the grand total field indicate the text box size is too small. We will make size adjustments to this report and create additional computed fields.
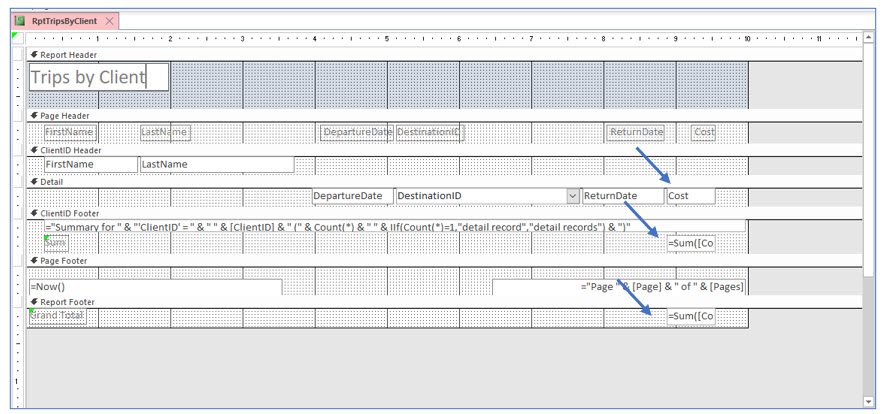
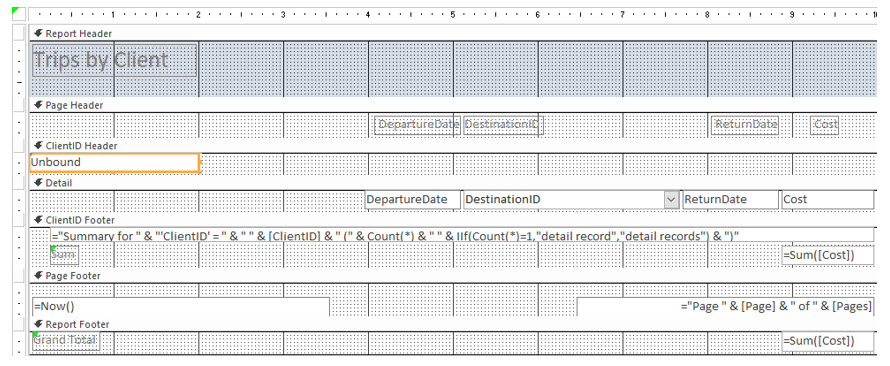
9. Close the preview and display the report in Design View. Change the title in the Report Header to read Trips by Client.
10. Widen the text boxes for the Cost and the two Sum([Cost]) fields by about 0.5”.
When you press and hold the (Ctrl) key, you can select all three text boxes with the mouse. Size them by dragging the sizing handle to the right. Sizing the three controls (i.e., text boxes) at one time keeps their sizes uniform.
11. Preview the report again to verify that the data in these text boxes is clearly visible.
Concatenating text fields
This report displays the first and last names in separate text boxes. The amount of white space between the client’s first and last names depends on how long or short the client’s first name is. To display the first and last names with a single space between them, you will have to concatenate the two name fields into one field. In this portion of the lesson, you will create a text field that displays a client’s name as the following example: Smith, Joe.
You will create a new text box and enter a formula in the text box that combines the two text fields and inserts two literal characters (comma and space) between them.
1. Return to design view, then in the Page Header, delete the FirstName and LastName labels.
2. In the Client ID Header, delete the FirstName and LastName text boxes.
You will now create a text box which displays the first and last names together by using field concatenation.
3. In the Controls group, click on the Text Box tool. Place a new text box in the Client ID Header section about 1” from the left edge of the page.
Be sure that you can see the label, which will be placed to the left of the new Unbound text box. The label needs to be visible to delete it. You will create a new label in Page Header.
4. Delete the label of the new text box. Then drag the left edge of the new text box to the left edge of the page. Adjust right edge of the text box to about the 2” mark on the horizontal ruler.
5. Copy one of the labels in the Page Header. Move it above the new text box and change the label to Client Name.
Resize the Page Header, if necessary. In the next step, you will enter a formula in the new text box to concatenate the first and last name fields.
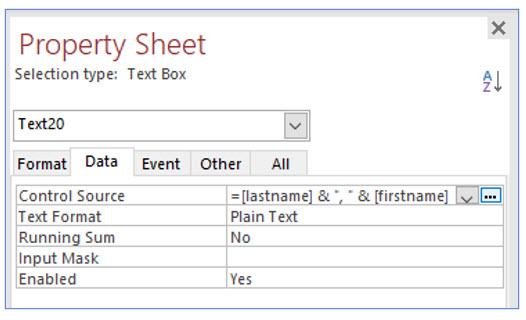
6. Display the Property Sheet of the new text box. In the Control Source row on the Data tab, type =[LastName]&”, “&[FirstName].
There is a space after the comma in the quotation marks, which are required for literal text. The ampersands (&) instruct Access to also include whatever follows in the text box. As we previously discussed, capitalization does not matter, but spelling does.
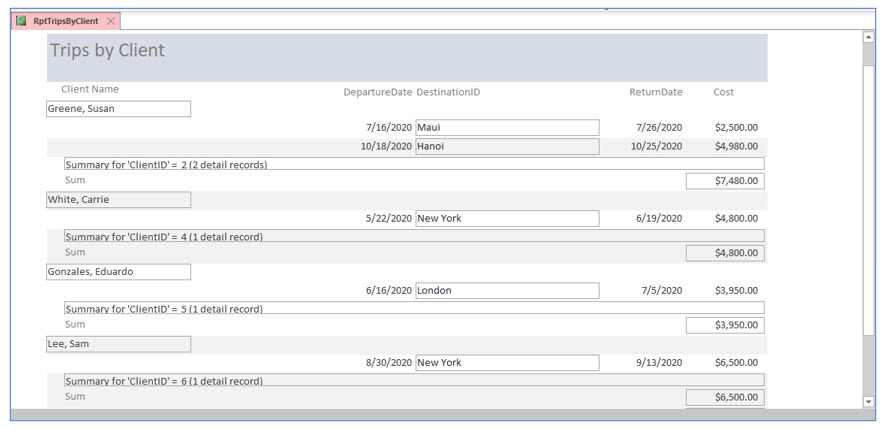
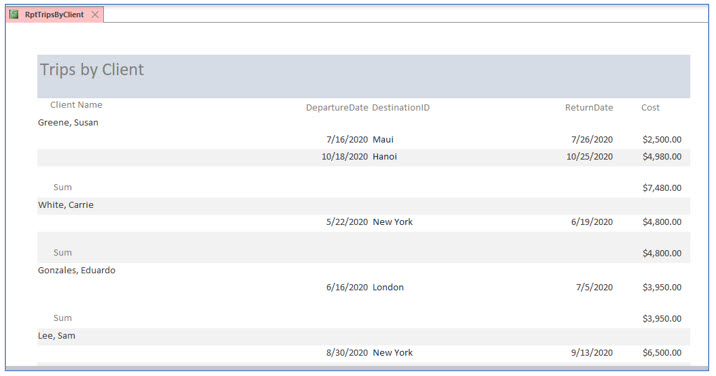
7. Preview the report to ensure that the clients’ names look similar in format to those in the following report.
We will now make some additional formatting changes to improve the appearance of the report.
8. Return to Design View of this report.
9. In the ClientID Footer section select and then delete the very top control.
This control prints “Summary for ClientID…” and is not necessary for this report.
Now we will remove the borders from some of the text boxes to further enhance the appearance of this report.
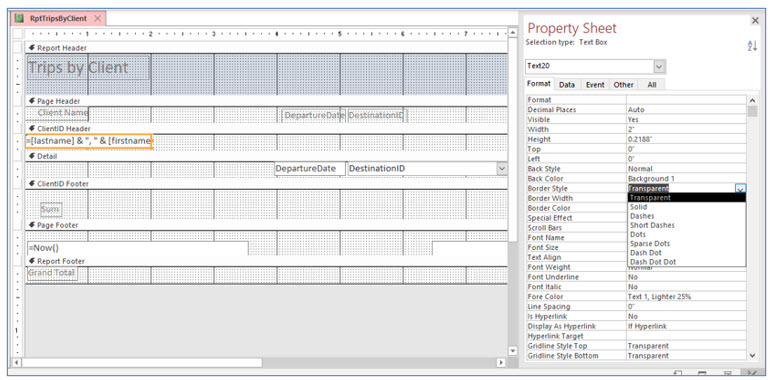
10. Right+click the textbox that displays the concatenated client name and choose Properties to display the Property Sheet. In the Format tab, change the Border Style to Transparent.
This will remove the border around this control.
11. Repeat the previous process for the DestinationID and the two Sum([Cost]) text boxes.
If you do not close the Property sheet pane you can simply click on each text box to select it and then change the border style.
12. Preview the report to verify those changes and return to Design View.
You will now add a field to count the number of trips. This will be a summary computation. You added the concatenated name field in the Detail section because every record had this calculated field. Since you want to count the number of trips booked by each client, so you will place the summary computation in the Client ID Footer. Placing the control in this section means that it will appear after just before the report displays the information for another client.
13. Return to Design View of this report.
14. Create a new text box and place it directly above the control that reads =Sum([Cost]) in the Client ID Footer.
15. Change the new label to read # of Trips. In the new text box, type =Count([Cost]).
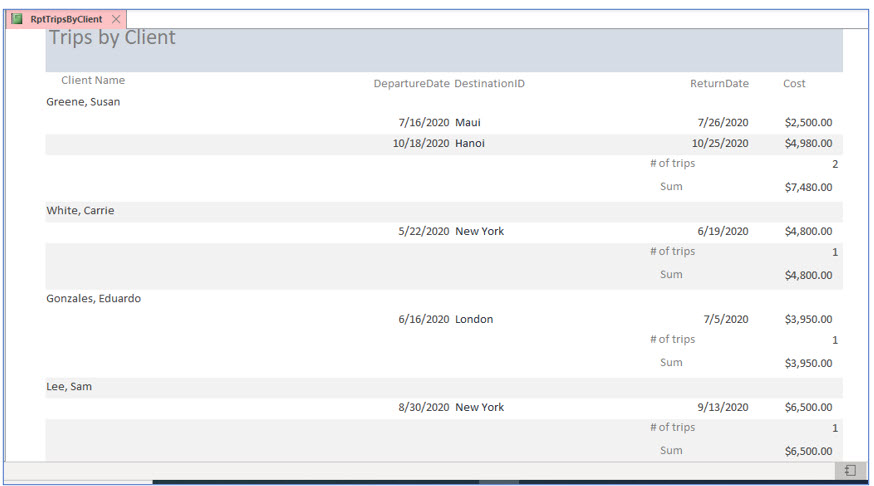
You can type the formula directly into the textbox or you can use the Property Sheet. The formula will count the number of times a cost appears in the detail section for this client, (which displays the trips booked by each client). This formula could have counted another field, but generally numeric fields work best in formulas.
16. Move and align both labels and textboxes in the Client ID Footer so they do not overlap.
Move the labels to the left of the return date field. You may want to experiment with the Align tool in the Arrange tab to align the textbox labels and controls.
17. On the Property Sheet Format tab for the Count textbox, change the Border Style to Transparent.
If you do not change the border style, the new text box will have a border.
18. Preview the report to verify you have entered the formula correctly.
If necessary to improve the report’s appearance, return to Design View and make sizing or positioning adjustments.
Controlling Page Breaks
Currently, this report only creates a new page when the previous page is completely full. If the clients in this database scheduled more trips, it may be helpful to have each client’s information start on a new page.
In this portion of the lesson you will have Access create a new page each time the ClientID changes. You can control page breaks in the format properties for the section you want to change. To create a new page with each client, you will add a page break to the ClientID Header.
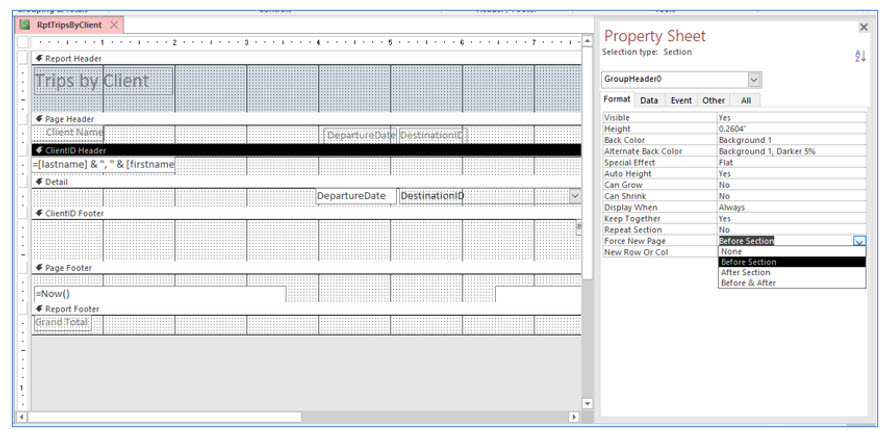
1. Return to the Design View of the report and click on the Client ID Header bar. Display the Property Sheet for this section.
Remember you can use the Property Sheet tool in the Tools group of the Design tab to display the Property sheet as well as using the right+click method.
2. Set the Force New Page property to Before Section.
The Force New Page property inserts a page break before displaying a new client, so that each client begins on a new page. One client’s trips may take several pages, but each client starts on a new page.
3. Close the Property Sheet and save the report design. Click the View tool on the ribbon and select Print Preview.
Report View does not show page breaks, but Print Preview does. Now, each client’s trips should appear on a new page. In the next steps, we will add page breaks after the main title and before the grand total.
4. Close Print Preview and return to Design View.
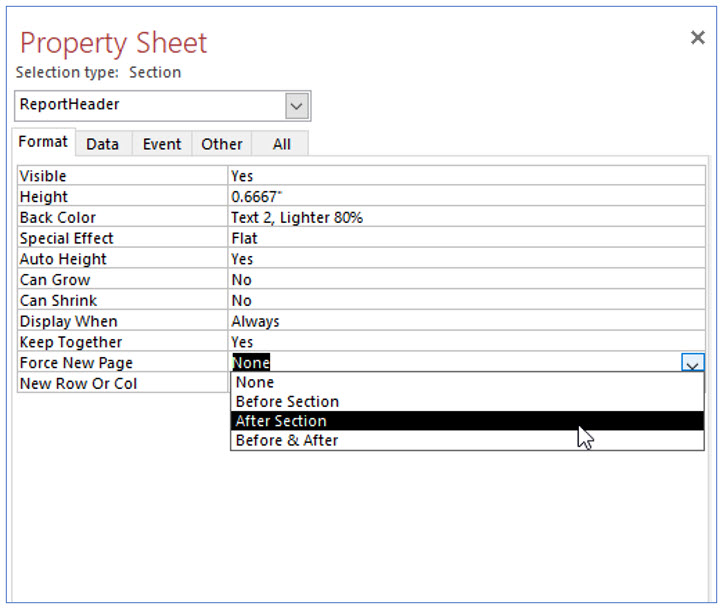
5. Display the Property Sheet for the Report Header. Change the Force New Page property to After Section.
6. Display the Property Sheet for the Report Footer. Change the Force New Page property to Before Section.
7. Save and view in Print Preview.
The report title and grand total should now appear on separate pages.
8. Close Print Preview and the report.
